Advanced Statistical Programming using R
Week 1: Introductions
2027-04-04
This Week
- Introductions
- Course overview & preliminaries
- Using LLMs in StatProg 2
- Intro to
Reminders
- Register for course on module (see email)
- Bookmark course website: https://soda-lmu.github.io/StatProg2-2026-SoSe/
- Follow installation & setup requirements: https://soda-lmu.github.io/StatProg2-2026-SoSe/setup.html
Introductions
Teaching Team

Dr. Cynthia Huang
Post-Doctoral Fellow
Research: Data quality, data visualisation, trustworthy data science

Leonhard Kestel
PhD student, SODA
Research: Neurosymbolic AI, algorithmic fairness

Lisa Bondo Andersen
PhD student, SODA
Research: Survey methodology, mouse movements
Getting to Know Each Other
Turn to the person next to you and find out their:
- Name?
- Major?
- Semester?
- Prior experience with R?
You will introduce them to the group.
Course overview
Course philosophy
- Developing data analysis ‘why’, ‘what’ & ‘how’ > learning a limited set of R skills
- Deliberate and strategic usage of AI assistance in data science
- Part 1: Foundations & developing ‘taste’
- Part 2: Application & practising ‘implementation’
- Incremental artefacts:
- Solo reflection log
- Collaborative project
- Oral exam
Learning objectives
- develop Foundational programming and workflow skills
- practice Data analysis pipeline design
- develop Critical reasoning and quality awareness
- practice Communication and collaboration
Learning activities
Solo: Individual reflection log
- writing clear and maintainable statistical programming code
- open science skills: version control, collaboration, literatre programming
- present and defend analysis decisions (possibly AI-assisted)
Collaborative: Group data analysis
- map out and reason about different stages of data analysis
- implement and document statistically appropriate data preparation and analysis tasks
- synthesis and communicate statistical findings appropriately based on audience and venue.
Collaboration & LLM usage
- Many of the lecture and practical activities are designed to be completed in groups. We strongly encourage you to work with and learn from each other.
- We will also actively explore ways to leverage and ‘collaborate’ with LLMs. Again, it is useful to work with others and compare results.
Important
In an age of AI, critical thinking skills such as statistical interpretation and LLM evaluation are becoming more and more important relative to engineering skills for implementing statistical code.
Class Format
- 1.5 hour interactive lecture
- Introduces new skills and concepts
- Exploring case studies and principles for ‘reasonable’ data analysis
- 1.5 hour practical
- Hands-on practice and assistance with new tools.
- Group work to build collaborative data analysis.
- Incremental documentation of learning and AI-usage.
Examination Format
Oral exam
- assessing your judgement and reasoning
- explain decisions,
- defend choices,
- and reason about alternative
- based on group project and individual practical exercises
More details to be provided closer to the examination date.
Assumed knowledge
We assume you know the following from StatProg1, Stat1 & Stat2:
- basics of programming in R (scripts, RStudio, installing packages etc.)
- literate programming with Quarto markdown documents (qmd)
- tidy data principles and basic data wrangling with dplyr and tidyr (pivoting, missing values, joins)
- data visualisation with ggplot2, accessibility best practices
- high level understanding of different data types and data sources (e.g. panel data, time-series, text)
- introductory statistical methods: descriptive statistics, linear regression, hypothesis testing
Assumed knowledge
Useful sources for revising these topics:
- Monash StartR modules: https://startr.numbat.space
- R4DS: https://r4ds.hadley.nz
- ModernDive textbook (v2): https://moderndive.com/v2/
- What the forgot to teach you about R: https://rstats.wtf/projects.html
Computational Setup Requirements
In this course we will use:
- R
- RStudio
- Quarto
- Command Line Interface
git- GitHub
And numerous R packages including tidyverse, and palmerpenguins.
You will cover all these in this week’s practical.
Preliminaries
What is statistical programming, and how does it relate to statistics and data science?
History of Modern Data Science
Four major influences act on data analysis today:
- The formal theories of statistics
- Accelerating developments in computers and display devices
- The challenge, in many fields, of more and ever larger bodies of data
- The emphasis on quantification in an ever wider variety of disciplines
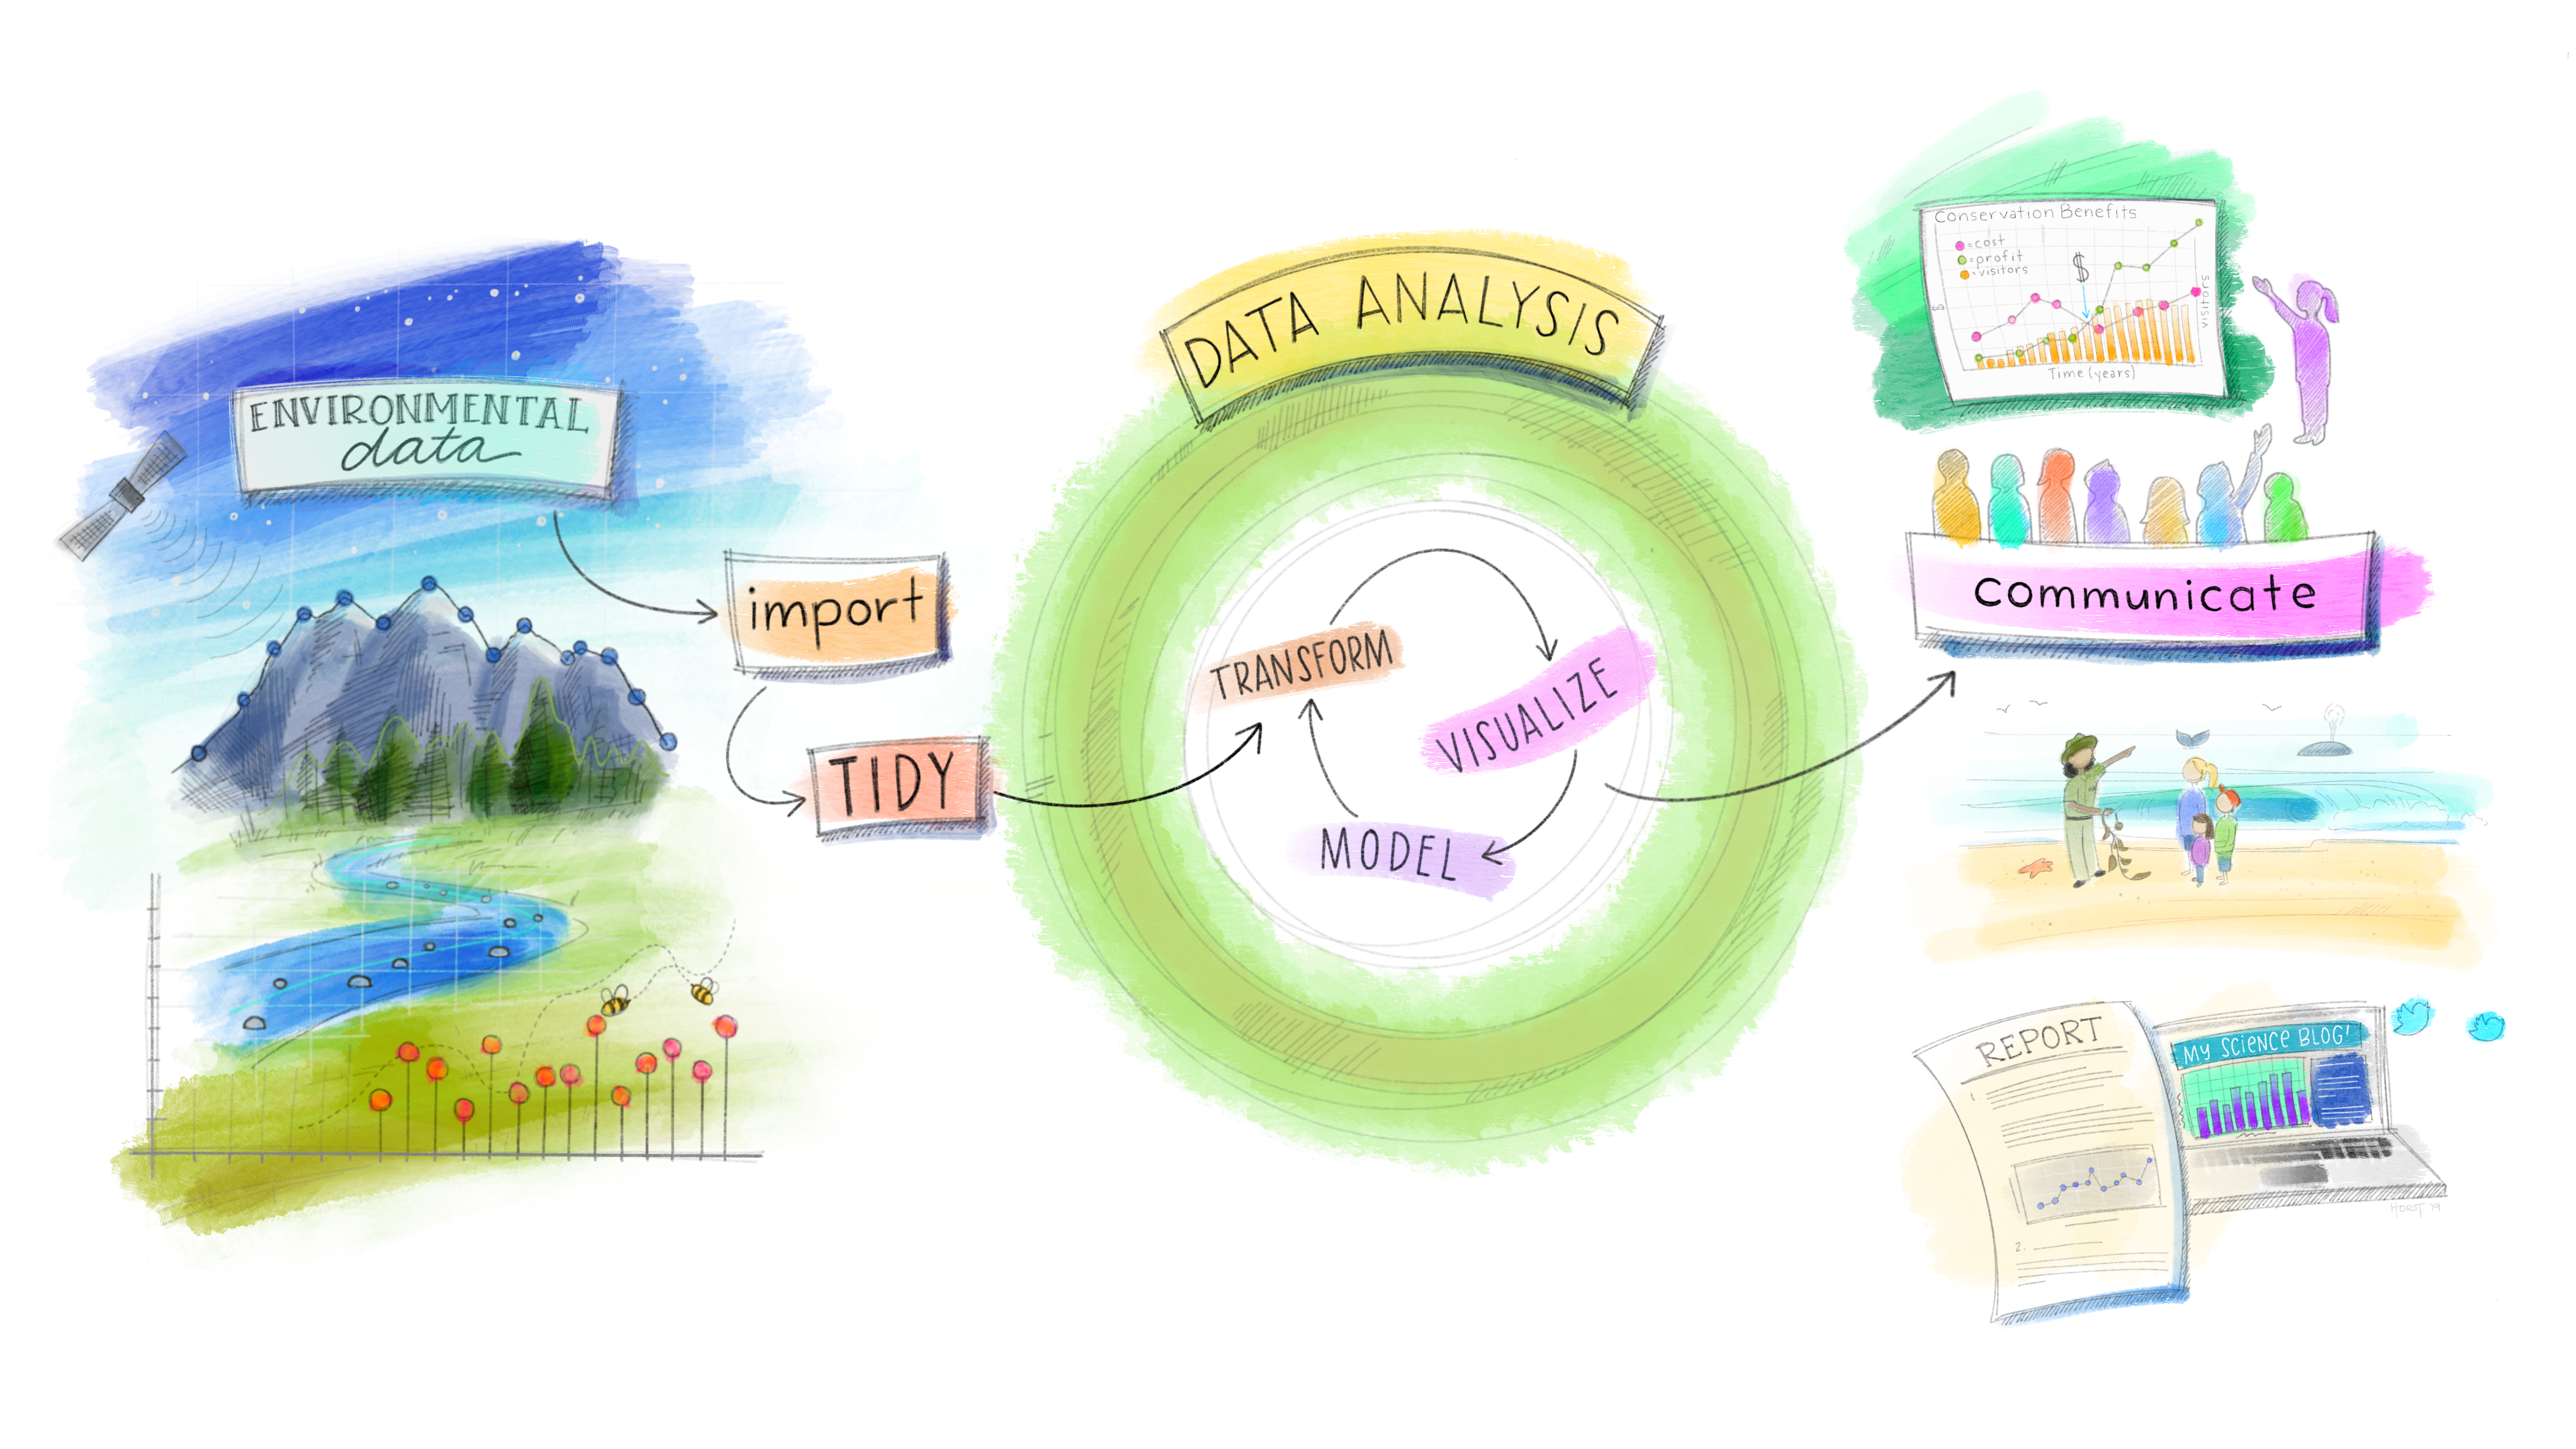
Greater Statistics: Learning from Data
Three broad categories characterize work in greater statistics:
- preparing data, including planning, collection, organization, and validation
- analysing data, by models or other summaries
- presenting data in written, graphical or other form.
– Chambers (1993)
History and Overview of R
R is a dialect of S1:
- S (1976, Chambers, Becker and Wilks; Bell Labs, USA)
- S-PLUS (1988, Doug Martin; Uni of Washington, USA)
- R (1993, Ihaka and Gentleman; Uni of Auckland, NZ)
R, S & tidy tools2 philosophy:
- useful for Interactive Data Analysis
- modular and extensible with Packages
- functional programming
- designed for humans first
Statistics + Programming = Learning from Data
This course aims to support you in learning from data using statistical reasoning AND computational tools.
Statistical
- thinking,
- inference,
- visualisation,
- modelling,
- and communication
Programming
- R packages and workflows
- code style and quality
- reproducibility practices
- version control & collaboration
- LLMs & generative AI
Data Science Workflow
Part 1: Statistical Programming Skills
- Scripts to Functions (with LLMs)
- Debugging basics
- Version control with Git & GitHub
- Quarto reports & websites
Part 2: Working with Real World Data
- Open data practices
- Preliminary data analysis & visualisation
- Data cleaning & documentation
- Confirmatory data analysis
- Effective statistical communication & graphics
Part 3: Special Topics (TBC) & Review
- W12: Interactive graphics
- W13: Multilingual workflows (R & Python)
- W14: Review
Looking Ahead: Group Project
In the hands-on project, you will:
- practice strategies for learning from data
- implement statistical programming tasks
- discuss and negotiate key decisions in data science workflows
- produce a data-driven report, story, dashboard or other final output
- leverage LLMs for assistance with statistical reasoning and programming
More details can be found on the course website. We recommend thinking about your dataset earlier! The earlier you start looking, the more likely you will find a dataset you will enjoy working on!
Dataset requirements
Your dataset:
- should contain data available under an open licence
- must have variation across at least two dimensions (e.g. time and space, or group and time)
- may contain more than one data table (e.g. like
nycflights13) - every data table should have an identification variable (you may create one) that uniquely identifies each observation
- be no larger than 10 MB (as raw csv files)
At least one data table should contain:
- > 50 rows,
- one numeric outcome variable
y(not binary 0/1), - two explanatory variables:
- one numeric variable:
x_1(can be time) - one categorical variable:
x_2
- one numeric variable:
Using LLMs in this course
Warning!
- It is not possible to master every tool, concept and application domain across data science.
- We will explore together the various ways LLMs can bridge gaps in your knowledge or skills.
- But, there is no replacement for practice when it comes to reasoning about and engage critically with data.
Principles for using LLMs
In coming lectures we will cover:
- task abstractions & prompting strategies
- Individual reflection log & AI-disclosure
- AI-Horizon platform
Intro to Git & CLI
These slides are adapted from https://rcp.numbat.space/week3/#/etc5513-title
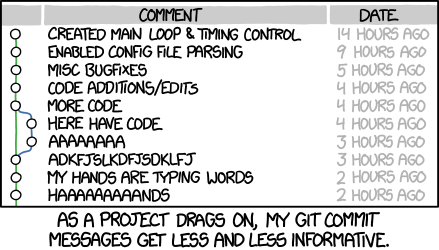
Is this you?
Or maybe this?
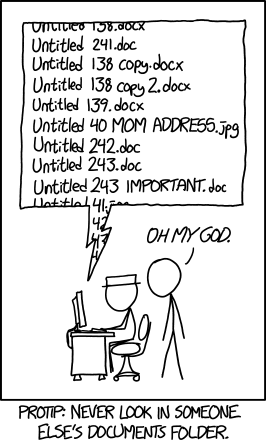
Version control to the rescue?
Version control systems are a category of software tools that help store and manage changes to source code (projects) over time. They can:
- track of every modification to the source code in a special kind of database,
- allow you to roll back to previous versions if a mistake is made, and compare the code to fix the problem while minimizing disruption,
- manage multiple versions of a project easily
It is a very useful (actually essential!) tool for collaborating and for sharing open source resources.
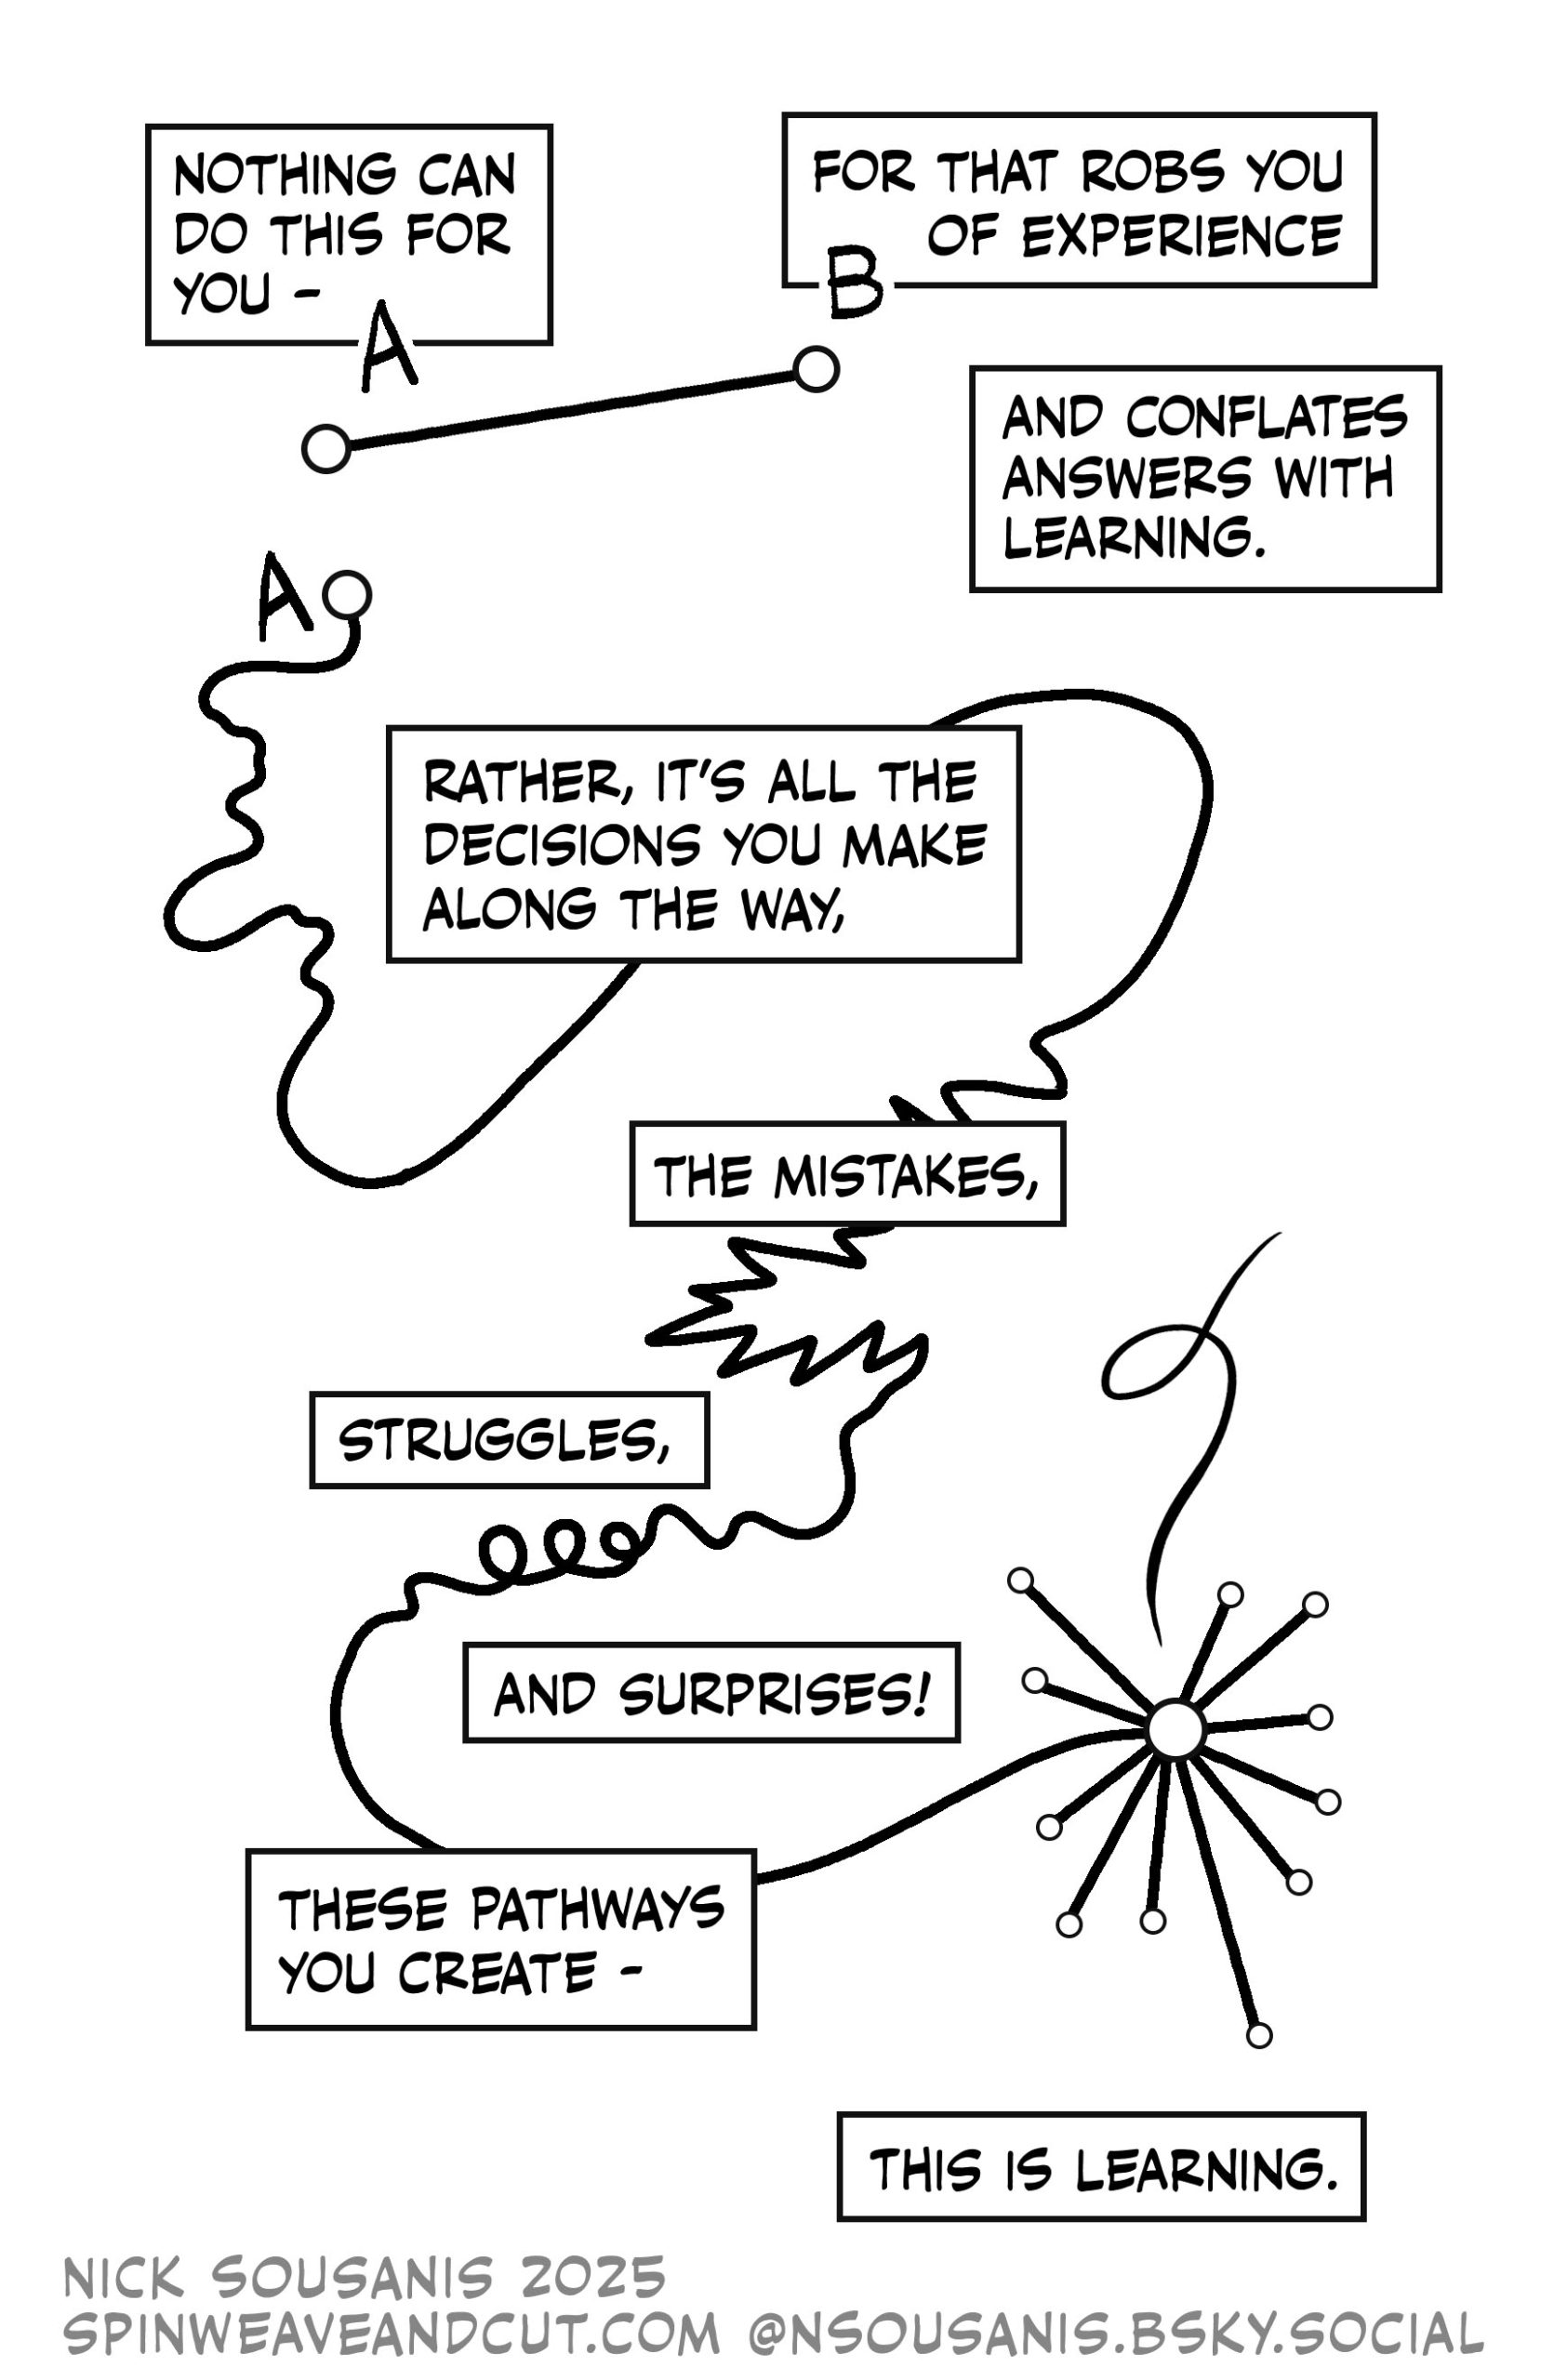
Incremental and collaborative learning
- Version control is intentional friction in this course
- There are no shortcuts for doing things step-by-step
- It will be frustrating and annoying at times
- But (hopefully) rewarding in the end!
What you need to master
- Basics of version control with git (this week)
- Basics of using the command line (this week)
- Basics of collaborative version control with git & GitHub
What is git?
- Version Control System (VCS)
- Looks at the changes in your files
- Records all changes over time to give you a full history
- Similar to “track changes” in Microsoft Word / LibreOffice
- For now, treat it like a diary or log of work chunks.
What is the command line?
- In most cases (non-linux users) use a Graphical User Interface (GUI) to interact with their programs and operating systems
- However, at the beginning of the computing times most people would use the command line interface to interact with their computer
Git and Command Line
We will learn how to use the shell/command line interface
Why?
- We will use the command line interface to interact with Git and with Github
- The shell or command line interface is an interface where the user types commands
- This interface allow us to control our computer using commands entered via our keyboard
- That means that instead of using a graphical user interface (GUI) + our mouse to open and close programs, create folders and moving files, we are going to type commands
Examples of things that we can do from the shell or terminal:
- Navigating through folders and files
- Create/delete folders
- Run and install programs (i.e interact with Git)
- And much more!
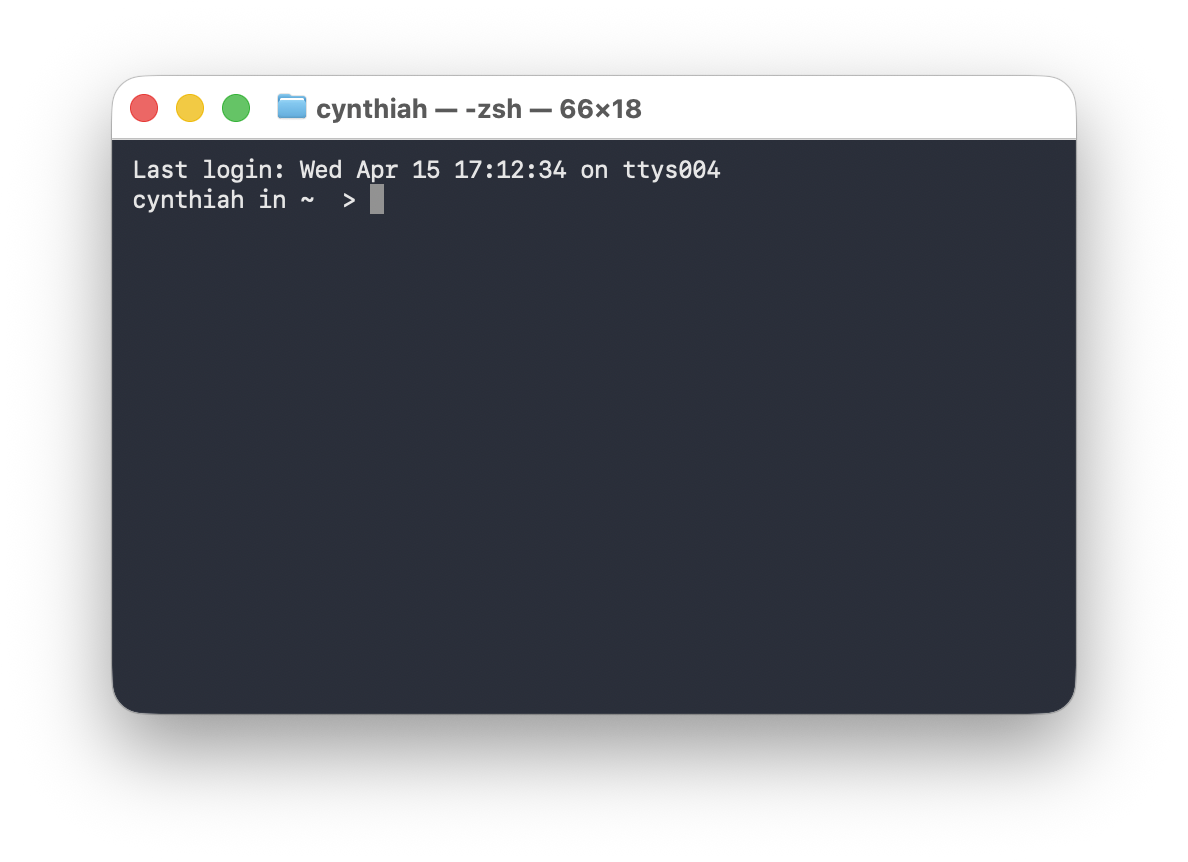
Terminal in action
Typically when you open your terminal, it will welcome you with a prompt that looks like this:
cynthia@computerid-macbook:~$or with the new Catalina Mac OX
cynthia@computerid ~ % On Windows it will contain the same elements but look like this:
cynthia@computerid-pc MINGW64 ~$Terminal in practice
We will start writing commands after ~$ or ~% depending on the terminal version that you are using
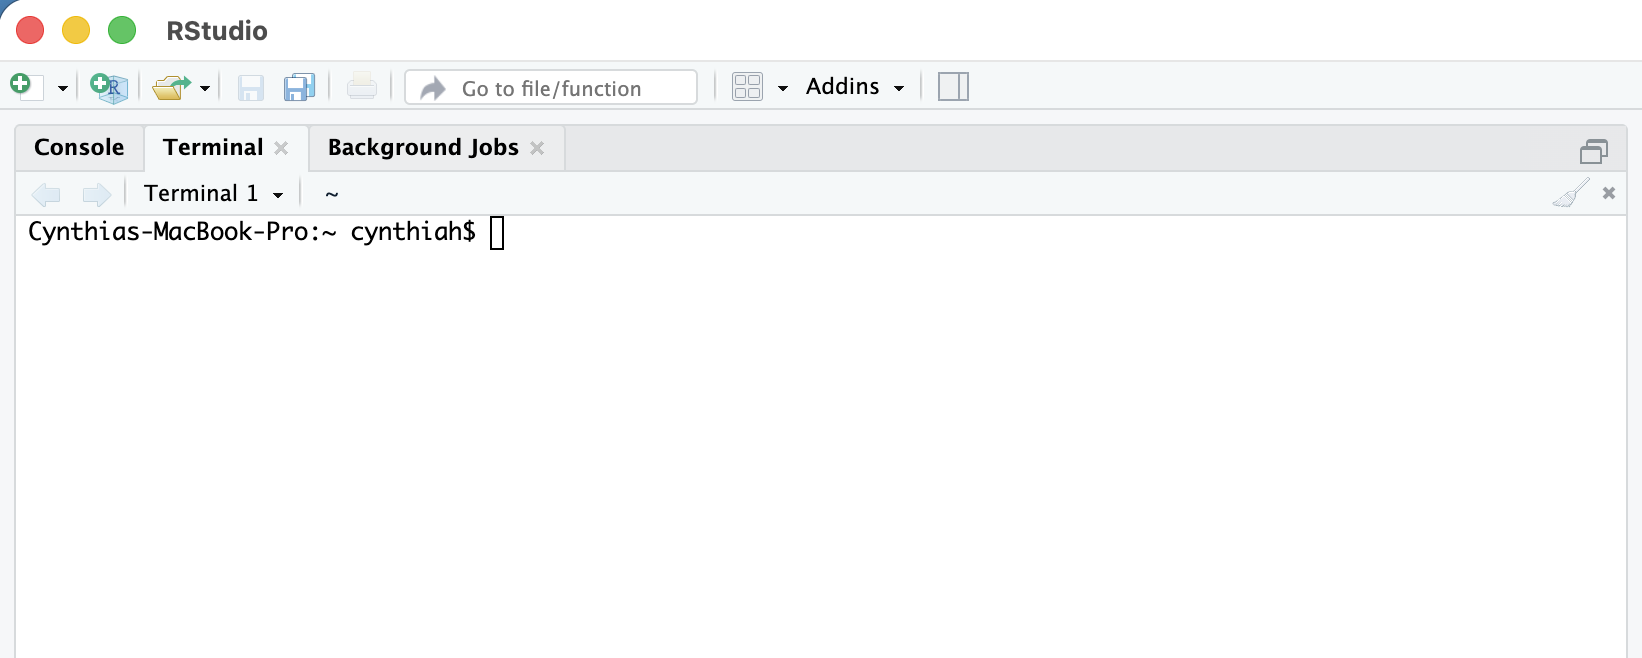
The commands that we are going to use are the same regardless the terminal version you have.
What is the path to my current computer location?
pwd: print working directory or present working directory
cynthiah@computerid~ % pwd
/Users/cynthiah/Documents/Courses/StatProg2
Understanding the output of pwd command:
/Users/cynthiah/Documents/Courses/StatProg2/represents the root directoryUsersis the Users directorycynthiahrefers to my directory or folder within the users directory- …
What is in my directory?
ls lists the files inside the current directory
cynthiah@computerid Documents~ % ls DocumentsCourses Research Teaching file.pdf example.txtDocumentsis an argument to thelscommand.lsgives you a list of all the elements in a directoryls -alist of all the files including hidden ones
Each Linux command (pwd,ls …) have lots of options (flags) that can be added.
A reference list of unix commands with options might be found here
Git commands
We will cover the workings of git in a future class. For now you will practice in the practical:
git initto initialise a folder as Git repository (i.e. start tracking version history in this folder.)git add filenameis a Git command that adds a change in the working directory to the staging area. (prepare to add this to the version history)git commit -m "Message": The Git commit command captures a snapshot of the project’s currently staged changes. (m = message for commit. The git commit is used to create a snapshot of the staged changes along a timeline of a Git projects history.)
Navigating between directories
cd: Change directory
- First we need to make sure where we are (
pwd). - The
cdcommand syntax is very simple, we just need to specify the directory that we want to navigate to - At any moment of your navigation, you can use the
pwdcommand to confirm your current location - A path that starts with
/is assumed to be absolute.
cd in practice!
My current location is Documents. I want to get to Documents/Research/DataVis
cd Researchmeans that we move intoResearchcd DataVismeans that we move intoDataVis.means the current directoryDataVis- The
~symbol is a shorthand for the user’s home directory and we can use it to form paths:- If you are in your
Downloadsdirectory (/Users/John/Downloads) typingcd ~will bring you to your Home directory/Users/John!
- If you are in your
More commands practice!
My current location is DataVis, or really Documents/Research/DataVis
..is shorthand for the parent of the current working directorycd ..means that we move intoResearch(1 directory up). That is fromDataVisback toResearchcd ../../means that we move up two directories: fromDataVistoDocumentsmkdir Project1 Project2means “make two new directories (folders) called Project1 and Project2”.
More commands practice!
mvmove files or folders: takes two arguments, the first being files or folders to move and the second being the path to move to.cpthis command is used to copy files or group of files or directories. When copy files we need to usecp -rto copy all the directory contents.rmremove files and folders- To remove entire folders
rmrequires the-r(recursive) flag - We can create empty files with
touch example.qmd
Cheat sheet for command line
Excellent summary about the commands that we will be using can be found here.