## load downloaded data
museum_visitors_raw <- readr::read_csv("demo/monatszahlen2603_museen_16_03_26.csv")
museum_visitors <- museum_visitors_raw |>
janitor::clean_names() # WERT → wert, AUSPRAEGUNG → auspraegung, …
## make plot
museum_visitors |>
dplyr::filter(
monat == "Summe"
) |>
ggplot2::ggplot(ggplot2::aes(x = jahr, y = wert, colour = auspraegung)) +
ggplot2::geom_line() +
ggplot2::labs(x = "Year", y = "Visitors", colour = "Museum") +
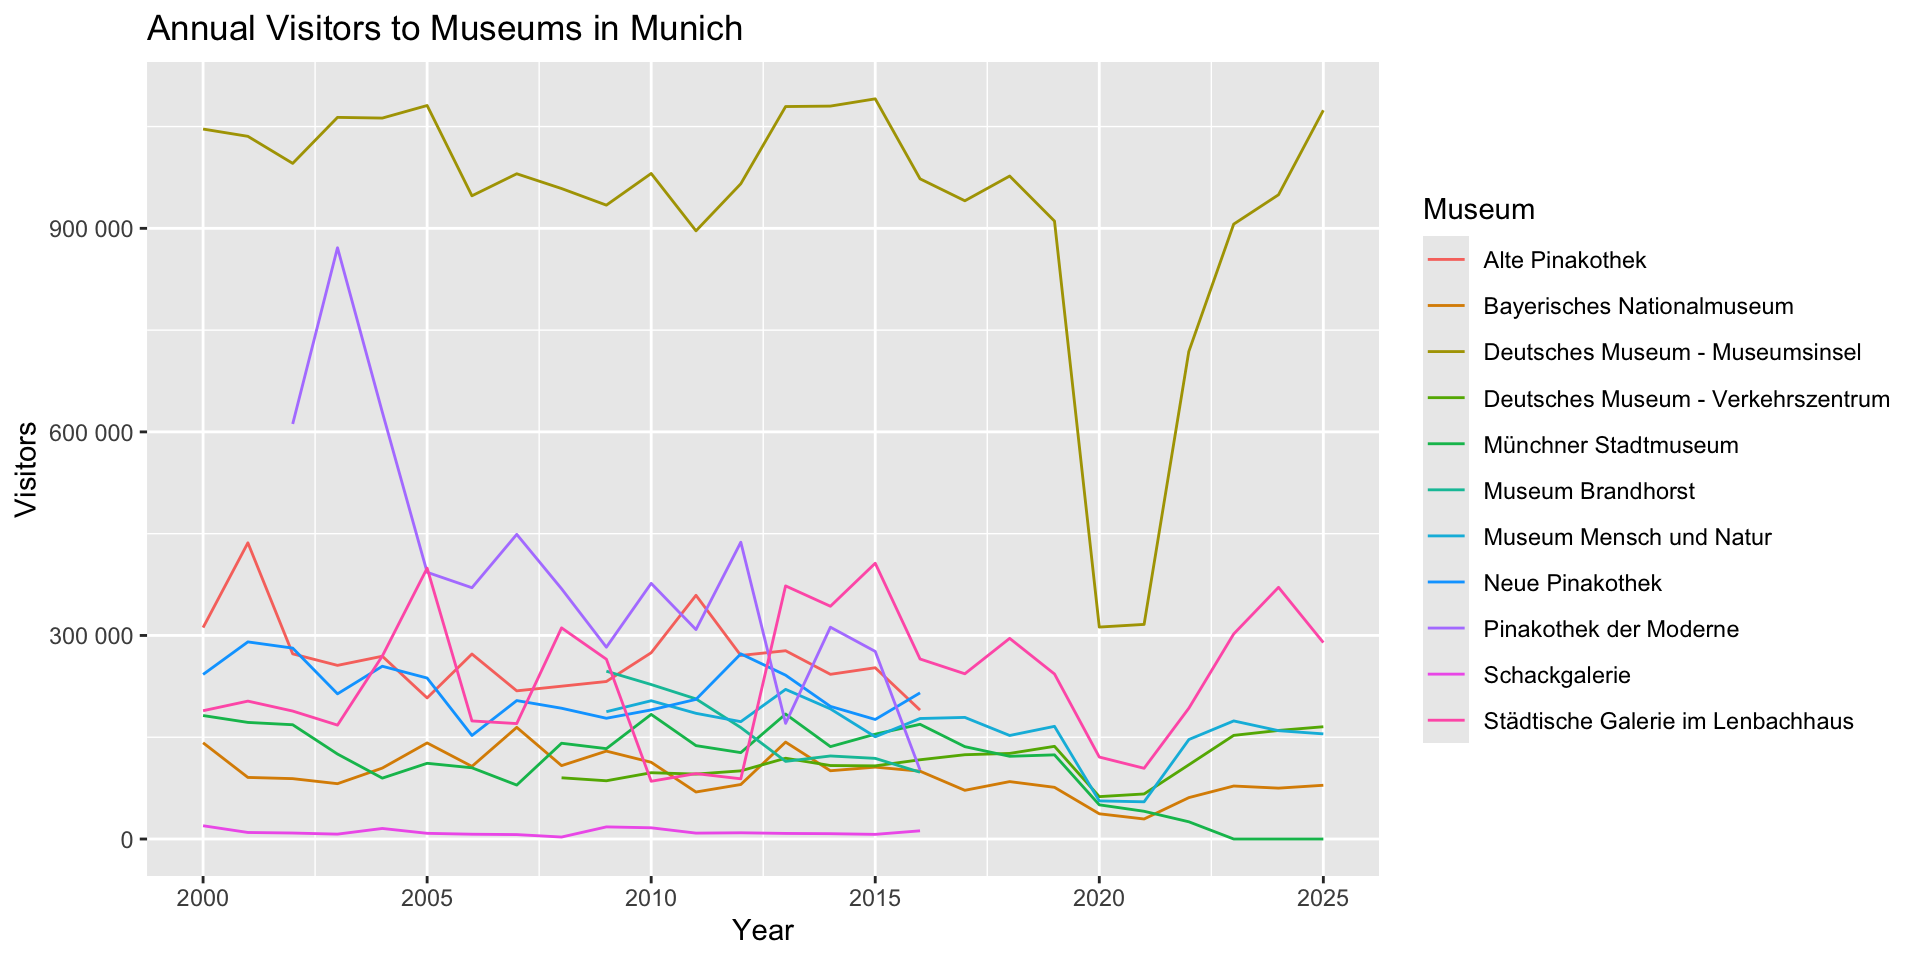
ggplot2::ggtitle("Annual Visitors to Museums in Munich") +
ggplot2::scale_y_continuous(labels = scales::label_number())Advanced Statistical Programming using R
Week 6: R Packages
2026-05-21
Announcements
Reminders
- Group project
- Register your group by May 22 on Moodle (if not done)
- Proposal due Mon 8 Jun — submit rendered webpage link on Moodle
- End of semester submissions:
- Group projects and reflections (through Group form on Moodle)
- Individual contribution statements (through Individual form on Moodle)
- No class Thu 4 Jun & Fri 5 Jun (public holiday period)
Syllabus
Part 1: Statistical Programming Foundations
- W02: Scripts, Functions & Refactoring
- W03: Debugging
- W04: Version Control & Remotes
- W05: Quarto Websites & Collaborative Coding
- W06: R Packages
Part 2: Working with Real World Data
- W07: Initial Data Analysis & Data Cleaning
- W09: Open Data & Renv
- W10: Modelling & Analysis
- W11: Statistical Communication & Visualisation
Part 3: Advanced Topics & Summary
- W12: Interactive Data Storytelling
- W13: Multi-lingual Analysis (Python/R)
- W14: Review & Outro
Group Project
Reminders
- All groups should be registered:
- Group member names & LMU campus emails
- GitHub repo (set up this week in lecture/practical)
- Proposal submission deadline extended to start of W8 (Mon Jun 8)
- Review the project guidelines
- Start searching for data sources, and designing your dataset
- Set up your project repository structure
- Include a proposal document & start drafting based on project proposal guidelines
Pick your datasets by W7 practical (May 29)!
The W7 practical will be based around helping you prepare your group project proposals. The practical will be most helpful if you have collected the data you plan to use in your projects.
Tips
Projects must be based on a cohesive set of data (i.e. your dataset), in a single GitHub repo, and available on the web. It is intended to help you gain hands-on experience with statistical programming skills.
If you don’t know where to start, try:
- Turning code for data import, cleaning, or tidying into functions — and collecting them into an R package
- Putting visualisations into different layouts on a Quarto webpage
- Describing how the dataset was collected and what it contains (variables, rows, licence)
- Documenting discussions — e.g. “We wanted to look at daily temperatures vs. museum visitors, but visitor numbers were only monthly, so we instead explored…”
FAQs
Q: What format is the project?
A: A Quarto website with pages such as: proposal, EDA & visualisations, modelling results, and a final presentation output (e.g. scrollytelling article, summary report, or interactive dashboard).
Q: Do we have to use a particular dataset?
A: No — any openly licensed data source is fine.
Q: Can we work in groups of 2? or alone?
A: Yes, though 3–4 is recommended so you have more chances to encounter merge conflicts and manage pull requests.
Suggestions for Final Output
The format should suit your analysis context and target audience:
- Statistical report — e.g. ModernDive example
- Collection of charts — e.g. VisTales example
- Interactive dashboard — using the Quarto Dashboards format
- Data storytelling article — using the Closeread extension
Key dates
| Milestone | Date | Submission |
|---|---|---|
| Group registration | May 20 | Group members, GitHub repo URL |
| Proposal | Start in W7 practical, due 8 Jun | URL to rendered proposal |
| Group reflection — in-class discussion | W14 practical | N/A |
Final submission + group-reflection.qmd |
Due 22 Jul | URL to final website/webpage, group reflection doc |
| Individual contribution statement | Due 23 Jul | PDF via Moodle |
| Oral exam | 29 Jul | — |
Submission Formats
- All group submissions will be via the Group form on Moodle
- The final submission should be a URL to a rendered website.
- The
group-reflection.qmddocuments what your group did, how you used LLMs, and key decisions contribution.pdfdocuments your contribution to your group project, and the specific tasks and skills you worked on.- For anyone working alone (i.e. groups of 1), your group reflection & contribution statements can be the same.
Important
Students who submit individual contribution statements will have oral exam questions related to their own work. Otherwise, the oral exam questions will involve generic projects.
This Week
- Git & GitHub so far
- R Packages
Recap: Git & GitHub
Benefits of version control
File version naming problem
Without version control, you might track versions of a document with names like:
analysis_final.R
analysis_final_v2.R
analysis_FINAL_submit.R
analysis_FINAL_submit_FIXED.R- Which script produced the submitted output?
- What did the cleaning step look like last Tuesday?
- What did your collaborator change last night?
Upgrading to version control systems
- Important checkpoints are saved as commits
- Each commit automatically includes useful metadata like date, time, author.
- Commit messages let you record manual details like why changes were made.
- You can recover previous versions of files, or return a whole repository back to a previous commit.
Collaborative Version Control in Statistical Programming
In this course, git & GitHub are used for:
- Logging individual weekly reflections
- Collaborating on a shared group project repository
- Publishing Quarto websites to showcase project work
(via the command line, and optionally RStudio)
Data analysis is iterative — it is not always clear where the important checkpoints are. A few guiding principles:
- Use branches to state your intentions before starting
- Commit early and often
- Write good commit messages
- Pull before you start working, push when you finish
- Use pull requests to merge branches
Local workflow
working directory  →  staging area  →  repository
   (your files)       (git add)        (git commit)
Set up & inspect
Good commit messages
- Short imperative summary (≤ 50 chars)
- One logical change per commit
- Describes what and why, not how
History, gitignore & restoring past versions
Restore a file or undo a commit
.gitignore — keep noise and secrets out
*.csv          # raw data files
docs/          # rendered outputs
_site/         # Quarto build cache
.env           # secrets
*.Rhistory # R session artefacts- One pattern per line; commit your
.gitignoreearly - gitignore.io — generator for
.gitignorefiles
Beware Secrets!
Once committed, a secret lives in history forever. Do not commit API keys, passwords or anything sensitive!
Remotes & GitHub
The day-to-day loop
GitHub  ──clone──▶  local       (once, to set up)
GitHub  ──pull───▶  local       (start of session)
local ──push───▶ GitHub (end of session)Fork vs clone
| Fork | Clone | |
|---|---|---|
| Lives on | GitHub | your machine |
| Connected to | original repo | a GitHub repo |
| Used for | contributing / group project template | working locally |
Tip
Pull at the start of every session, push at the end — keeps conflicts small and your team in sync.
Branches & parallel work
Branches — isolated lines of development
Merging
Extension: Stash & Worktree (not examinable)
Stash — desk drawer for half-done work
Tip
Use stash for short interruptions; worktree when you need both branches open for an extended time.
Pull requests & merge conflicts
The pull request workflow
git switch -c my-feature— create a branch- Make commits on that branch
git push -u origin my-feature— push to GitHub- Open a Pull Request on GitHub
- Collaborators review and comment
- Merge when approved; delete the branch
Resolving merge conflicts
Git marks collisions directly in the file:
<<<<<<< HEAD
result <- mean(x, na.rm = TRUE)
=======
result <- median(x, na.rm = TRUE)
>>>>>>> feature-branch- Open the conflicting file
- Choose a version — or write a combined version
- Delete all three marker lines
git add <file>thengit commit
Tip
Small, focused commits and frequent pulls keep conflicts rare and easy to resolve.
Git is hard
- It is normal to feel frustrated working with git!
- Version control encourages incremental and modular work
- Building incrementally via commits is intentional friction in this course!
- Adding different data analysis components week by week via branches is also intentional friction!
- Slow down so you have the chance to learn how to design, implement and present data analyses, even with the assistance of LLMs.
Bonus Tip: Use Quarto Includes to Reduce Merge Conflicts
The problem
Two teammates both edit report.qmd → merge conflict every time.
The solution: split into separate files
report.qmd          ← assembles everything
_eda.qmd            ← Alice owns this
_modelling.qmd      ← Bob owns this
_intro.qmd ← Charlie owns thisWhy this works
- Each person works on their own file — edits never overlap
report.qmdonly changes when structure changes (rare)- Files render into a single seamless document
Tip
Agree on file ownership at the start of each sprint — note it in a GitHub issue or CONTRIBUTING.md.
R Packages
What is an R Package?
- A directory with a specific structure that R knows how to install, load, and document
- Contains functions (
R/), metadata (DESCRIPTION), and optionally data, tests, and vignettes - Once installed, you load it with
library(pkgname)— just likeggplot2ordplyr - CRAN packages are community-vetted; your own packages can live on GitHub or just your machine
Extension: CRAN as a monorepo
A monorepo is a single repository that holds many independent projects. CRAN works like a distributed monorepo: all packages share one dependency graph and must pass the same R CMD check standards. If all the world were a monorepo explores the tradeoffs.
Why Write an R Package?
The copy-paste trap
- Which version is correct?
- A bug fix must be applied in every project manually
- No tests, no documentation, no guarantee of consistency
A package solves all of this
- One source of truth — install once, use everywhere
- Documentation — forces you to write
@param,@returns, and examples - Testing — unit tests run with
devtools::test()on every change
More Package Benefits
- Sharing —
devtools::install_github("you/mypackage")from any machine - LLM context — a package is a self-contained unit that LLMs can reason about reliably
- Data packages — a package whose primary purpose is distributing clean, documented datasets (e.g.
nycflights13,gapminder)
R Package Structure
mypackage/
├── DESCRIPTION        ← metadata & dependencies
├── NAMESPACE          ← exports (auto-generated)
├── R/                 ← your functions (.R files)
├── man/               ← help pages (auto-generated)
├── tests/
│   └── testthat/      ← unit tests
└── vignettes/         ← long-form docs (optional)
Tip
When reviewing LLM-generated packages, check DESCRIPTION and NAMESPACE first — these are where silent errors hide.
The two files you must never edit by hand
NAMESPACE— managed bydevtools::document()man/*.Rd— generated from roxygen2 comments inR/
The one file you always edit by hand
DESCRIPTION— title, description, version, authors, licence, dependencies
Tools for developing R packages
usethis
An automation package for setting up and configuring R projects and packages. It handles the repetitive file-creation and boilerplate tasks so you don’t have to do them by hand.
devtools
A package that wraps the core R package development cycle. It lets you iteratively build, load, document, test, and check your package without leaving R.
Tip
usethis for setting up, devtools for doing.
Your first R package
Based on:
Example: munichvisitors data package
Let’s make a package based on data from Landeshauptstadt München (20.02.2017).
        Monatszahlen Museen.
        Statistisches Amt München. Lizenz: Datenlizenz Deutschland Namensnennung 2.0 (dl-by-de).
        Abgerufen am 16.05.2026 von https://opendata.muenchen.de/dataset/monatszahlen-museen
We will include the data directly in the package, and also write a function that creates a ggplot2 based on the data.
Example: Interactive Script
Assume we have already downloaded the data table from: https://datengartln.de/datasets/detail/bfb4a286-bea5-4bfe-82ce-b9bd354284a5/
Then we wrote code to:
Preview: The raw data
# A tibble: 4 × 9
MONATSZAHL AUSPRAEGUNG JAHR MONAT WERT VORJAHRESWERT VERAEND_VORMONAT_PRO…¹
<chr> <chr> <dbl> <chr> <dbl> <dbl> <dbl>
1 Besucher*i… Alte Pinak… 2026 2026… NA NA NA
2 Besucher*i… Alte Pinak… 2026 2026… NA NA NA
3 Besucher*i… Alte Pinak… 2026 2026… NA NA NA
4 Besucher*i… Alte Pinak… 2026 2026… NA NA NA
# ℹ abbreviated name: ¹VERAEND_VORMONAT_PROZENT
# ℹ 2 more variables: VERAEND_VORJAHRESMONAT_PROZENT <dbl>,
# ZWOELF_MONATE_MITTELWERT <dbl>Preview: IDA & Cleaning (next week!)
## load downloaded data

museum_visitors_raw <- readr::read_csv("demo/monatszahlen2603_museen_16_03_26.csv")

museum_visitors <- museum_visitors_raw |>
  janitor::clean_names() # WERT → wert, AUSPRAEGUNG → auspraegung, …

## make plot

museum_visitors |>
  dplyr::filter(
    monat == "Summe"
  ) |>
  ggplot2::ggplot(ggplot2::aes(x = jahr, y = wert, colour = auspraegung)) +
  ggplot2::geom_line() +
  ggplot2::labs(x = "Year", y = "Visitors", colour = "Museum") +
  ggplot2::ggtitle("Annual Visitors to Museums in Munich") +
  ggplot2::scale_y_continuous(labels = scales::label_number())
Important workflow functions
usethis — scaffolding and setup
usethis::create_package()— initialise the directory structureusethis::use_data_raw()— set updata-raw/for raw data scriptsusethis::use_r()— create a new.Rfile inR/usethis::use_package()— add a package toDESCRIPTION
devtools — the development loop
devtools::load_all()— reload package without restarting Rdevtools::document()— generate.Rdhelp files from roxygen2devtools::test()— runtestthattestsdevtools::check()— run fullR CMD check
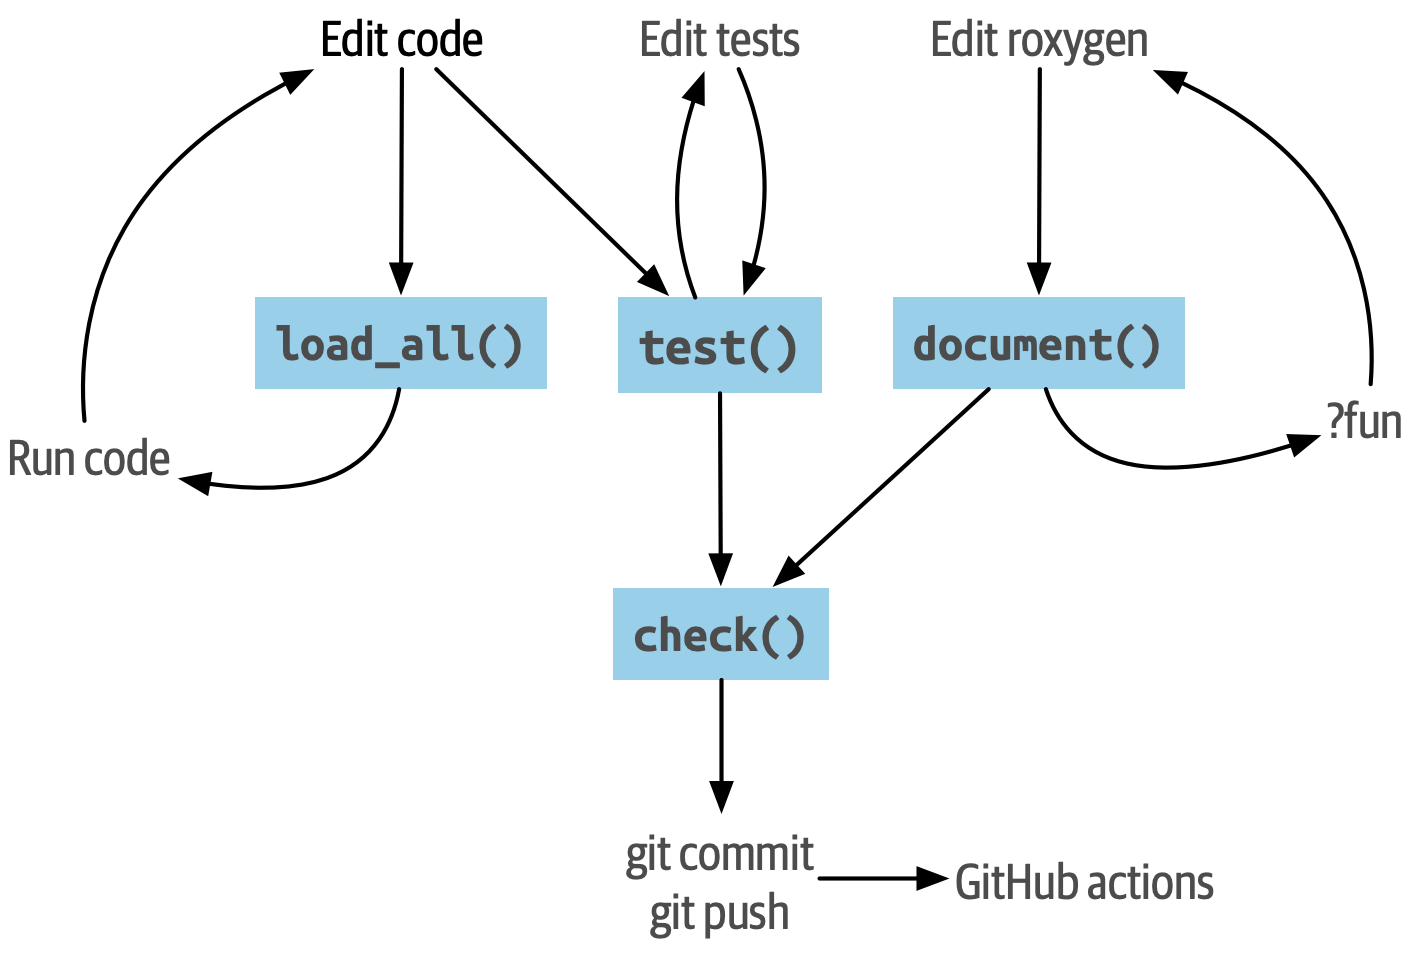
Development workflow preview
Setup: create_package()
Run in the R console (not the terminal):
Package scaffold created:
munichvisitors/
├── DESCRIPTION
├── NAMESPACE
├── README.Rmd
├── R/
├── munichvisitors.Rproj
├── .gitignore
└── .Rbuildignore
Tip
NAMESPACEand.Rbuildignoreare managed bydevtools/usethis— don’t edit them by hand.README.Rmdshould be rendered toREADME.mdto display automagically on your GitHub repo
Add data: use_data_raw()
Exported data objects go in data/, and the scripts that produce them go in data-raw/:
This creates data-raw/museum-visitors.R. Write the full download-and-clean script there, then call usethis::use_data() at the end to save the result.
Tip
Users get the cleaned .rda — not the raw files. Keep raw data scripts in data-raw/ committed but not installed.
The data-raw script
data-raw/museum-visitors.R
## code to prepare `museum_visitors` dataset goes here
url <- paste0(
  "https://opendata.muenchen.de/dataset/bfb4a286-bea5-4bfe-82ce-b9bd354284a5/",
  "resource/6c6a809e-91ee-4f3e-9268-a8b7bc38311c/download/",
  "monatszahlen2603_museen_16_03_26.csv"
)

museum_visitors_raw <- readr::read_csv(url)

museum_visitors <- museum_visitors_raw |>
  janitor::clean_names()   # WERT → wert, AUSPRAEGUNG → auspraegung, …

usethis::use_data(museum_visitors, overwrite = TRUE)
Tip
janitor::clean_names() converts all column names to snake_case — consistent and pipe-friendly.
Add data: usethis::use_data()
- Saves
data/museum_visitors.rdaand addsLazyData: truetoDESCRIPTION— the dataset is only loaded into memory when a user actually accesses it overwrite = TRUE— re-run the script to refresh the data without errors- Each exported dataset should be one object, one file — the filename must match the object name
Add data: package files
After usethis::use_data_raw() and usethis::use_data(), the package structure should look more like:
munichvisitors/
├── DESCRIPTION
├── NAMESPACE
├── README.Rmd
├── README.md
├── R/
├── data/
│   └── museum_visitors.rda  ← cleaned dataset (auto-generated by use_data())
└── data-raw/
    └── museum-visitors.R    ← download & clean script
Load & Check: devtools::load_all()
devtools::load_all() loads your package into the current session without installing it:
Tip
Reload often — avoid manually source()-ing files. load_all() is faster and closer to how users experience your package.
Add functions: use_r()
Let’s add a function to make a plot from the museum visitor table:
Copy the function body from the interactive script earlier:
plot_museums <- function() {
  museum_visitors |>
    dplyr::filter(
      monat == "Summe"
    ) |>
    ggplot2::ggplot(ggplot2::aes(x = jahr, y = wert, colour = auspraegung)) +
    ggplot2::geom_line() +
    ggplot2::labs(x = "Year", y = "Visitors", colour = "Museum") +
    ggplot2::ggtitle("Annual Visitors to Museums in Munich") +
    ggplot2::scale_y_continuous(labels = scales::label_number())
}
After adding functions: package files
After usethis::use_r() and devtools::document(), the structure grows to include R/ contents and man/:
munichvisitors/
├── DESCRIPTION
├── NAMESPACE
├── README.Rmd
├── README.md
├── R/
│   ├── data.R             ← dataset documentation
│   └── plot_museums.R     ← helper function
├── man/
│   ├── museum_visitors.Rd
│   └── plot_museums.Rd
├── data/
│   └── museum_visitors.rda
└── data-raw/
    └── museum-visitors.R
Load & Check (again): devtools::load_all()
devtools::load_all() loads your package into the current session without installing it:
Review: Debugging in Packages
| Tool | When to use |
|---|---|
traceback() / rlang::last_trace() |
Locate where an error originated |
browser() |
Pause inside your own function to inspect state |
debugonce(fn) |
Pause inside a function you can’t edit (e.g. from another package) |
devtools::load_all() |
Reload the package after changes without restarting R |
Tip
To debug a function from your own package interactively: edit R/fn.R, add browser(), call devtools::load_all(), then call the function. Remove browser() before committing.
Add dependencies: use_package()
If your function uses another package, declare it — never use library() inside a package:
Call imported functions with :::
plot_museums <- function() {
  museum_visitors |>
    dplyr::filter(
      monat == "Summe"
    ) |>
    ggplot2::ggplot(ggplot2::aes(x = jahr, y = wert, colour = auspraegung)) +
    ggplot2::geom_line() +
    ggplot2::labs(x = "Year", y = "Visitors", colour = "Museum") +
    ggplot2::ggtitle("Annual Visitors to Museums in Munich") +
    ggplot2::scale_y_continuous(labels = scales::label_number())
}
Tip
Every imported package is a dependency your users must also install. Prefer base R or well-established packages.
Documenting Packages
R Packages as Communication
A package is a structured answer to four questions users will ask:
- What is this? —
DESCRIPTIONtitle and description field - Why this package? —
READMEwith a motivating example and installation instructions - What does it do? — function and dataset documentation (
?fn,?dataset) - How do I use it? — examples in
@examples, vignettes for workflows
Tip
Write the README and one example before you write the internals — it forces you to think like a user.
DESCRIPTION
usethis sets up a template DESCRIPTION file — edit it for your package:
Package: munichvisitors
Title: Monthly Visitor Counts for Munich Museums
Version: 0.0.0.9000
Authors@R:
    person("First", "Last", , "you@example.com", role = c("aut", "cre"))
Description: Provides tidy monthly visitor statistics for Munich's museums
    from Munich Open Data (Statistisches Amt München), with a helper
    plot function.
License: MIT + file LICENSE
Encoding: UTF-8
Roxygen: list(markdown = TRUE)
RoxygenNote: 7.3.2
Tip
Choose a package name that reflects the scope of the data, not a single dataset. In the practical you will add a second dataset — a name like munichvisitors (all visitor counts) ages better than munichmuseums (museums only).
README
A README is the first thing a user sees before installing your package.
Template from R Packages (2e):
- A paragraph describing the purpose of the package
- An example showing how to solve a simple problem
- Installation instructions (
devtools::install_github("you/munichvisitors")) - An overview of the main components
Document functions with Roxygen2
roxygen2 is an R package that lets you write documentation directly above your functions as specially formatted comments (#').
- You write
#' @param,#' @returns,#' @exportabove the function devtools::document()reads those comments and generates the.Rdfiles inman/that power?fn- Documentation lives next to the code — harder to forget to update
Tip
roxygen2 comments start with #' (note the apostrophe), not #. A plain # is a regular code comment and will be ignored.
Common roxygen2 tags
| Tag | Purpose | Required? |
|---|---|---|
@param name desc |
Document a function argument | ✓ |
@returns desc |
What the function returns | ✓ |
@export |
Make the function available after library() |
✓ |
@examples |
Runnable examples (checked by R CMD check) |
✓ |
@description |
Longer description paragraph | |
@seealso |
Link to related functions | |
@family group |
Group related functions in help pages | |
@inheritParams fn |
Reuse another function’s @param docs |
|
@examplesIf cond |
Examples that only run when cond is TRUE |
|
@rdname name |
Merge docs for multiple functions into one page |
Document plot_museums
Document plot_museums
Add a roxygen2 comment block directly above the function:
Including Example Usage
The @examples tag in a roxygen2 block contains runnable R code that appears in the help page and is executed by devtools::check():
#' Line chart of annual museum visitor counts in Munich
#'
#' @param data A data frame with columns `jahr`, `wert`, `auspraegung`.
#' @returns A `ggplot2` plot object.
#' @export
#' @examples
#' plot_museums()
#' plot_museums(data = museum_visitors)
plot_museums <- function(data = museum_visitors) {
  data |>
    ...
}
Tip
Examples must run without errors. Use @examplesIf when an example needs network access or a file that may not be available.
Documenting data
Data objects also need documentation. By convention, put it in R/data.R:
#' Monthly visitor counts for Munich museums
#'
#' @format A data frame with one row per museum per month:
#' \describe{
#'   \item{auspraegung}{Museum name}
#'   \item{jahr}{Year}
#'   \item{monat}{Year-month code (YYYYMM format)}
#'   \item{wert}{Visitor count for that month}
#'   \item{vorjahreswert}{Visitor count in the same month of the prior year}
#'   \item{...}
#' ...
#' }
#' @source <https://datengartln.de/datasets/detail/bfb4a286-bea5-4bfe-82ce-b9bd354284a5/>
"museum_visitors"
Tip
Document the dataset name as a string ("museum_visitors") — not a function call. Column names reflect the cleaned (lowercase) versions after janitor::clean_names().
Generating help files
Writing a roxygen2 block doesn’t generate the .Rd file automatically. Run:
Important
For a function to be accessible after installing the package, it must have @export.
Extension: Tests & Vignettes
Not examinable but useful to know.
Tests
A test is code that checks your code behaves as expected — automatically, every time you run it.
- Written with the
testthatframework:test_that("description", { expectations }) - Each
expect_*()call is one assertion — e.g.expect_equal(),expect_s3_class(),expect_error() - Tests live in
tests/testthat/test-<function>.R - Run with
devtools::test()— takes seconds; catches regressions before your users do
Tip
A failing test is information, not failure — it tells you exactly what broke and where.
Why test?
Without tests
- You change one function — did anything break?
- You don’t know until a collaborator (or student) hits an error
- Fixing bugs silently breaks things you forgot were connected
- LLM-generated code passes inspection but fails on edge cases
With tests
- Every change is checked automatically —
devtools::test()takes seconds - Bugs are caught at the source, not downstream
- You can refactor confidently — tests tell you when you break the contract
- Tests are documentation: they show how a function is meant to be called
Testing
Adding a test:
Write expectations in the test file:
Running Tests & Examples
devtools::test()is fast — run it after every changedevtools::check()is thorough — run it before committing or submittingR CMD checkruns your@examplestoo — broken examples will fail the check
Tip
Aim for a clean check (no ERRORs, WARNINGs, or NOTEs) before sharing your package.
Vignettes
Documentation is great for looking up a specific function. But what if you’ve just installed a package and want to know how to use it?
Enter the vignette — a “how-to” guide that walks through a workflow using your package.
When writing the vignette, take the position of the reader — not the developer:
- Your audience has never used your package before
- Ask a friend to follow it and note where they get stuck
- If something is hard to explain, consider changing the code instead
Tip
Check out the dplyr vignettes for examples.
Package websites
pkgdown turns your package documentation into a website automatically:
- Function reference pages from
.Rdfiles - Vignettes rendered as articles
- README as the home page
Tip
Once set up, the site rebuilds on every push via GitHub Actions — zero extra effort.
Package websites
Example: dplyr.tidyverse.org
Designing R Packages
Recap: Inside-Out, Outside-In Functions
Outside-In — design the interface first
- Write the call before you write the body
- Ask: what am I trying to do? what do I need? what do I return?
- Once the interface feels right, filling in the body is easier
Inside-Out — refactor working code into functions
- Start with working interactive code
- Identify chunks that express one task or idea
- Give those chunks sensible names, then extract them
- Go back and think about how the functions work together
Tip
The outside (interface) shapes the inside (implementation) — and vice versa. Iterate between both.
Function arguments
Hidden data — zero-argument convenience function
- Simple to call:
plot_museums() - Works like an “autoplot” — the dataset is implicit
- Less flexible: always plots the same data
Tip
Expose the data argument when users might want to filter, update, or swap in their own data. Keep it hidden for simple “plot this dataset” helpers.
What functions to include?
Group by purpose, not by coincidence
- Functions that operate on the same data type or domain belong together
- Internal team tools (data cleaning pipelines, custom plots) make a natural package
- Avoid mega-packages — if the functions don’t share a coherent theme, split them
Aim for a consistent interface
- Similar functions should have similar argument names and order
data(or the main object) goes first — pipe-friendly- Options and flags go last with sensible defaults
- A user should be able to guess the call for a new function from one they already know
LLM-generated R Packages
LLMs can scaffold a working package quickly — but you need to review carefully:
- Be specific about the interface — tell the LLM exactly what functions you want, what they take, and what they return; vague prompts produce vague APIs
- Check
DESCRIPTION— LLMs often add unnecessaryImports; every dependency is a liability - Check
NAMESPACE— missing@exporttags mean functions are silently unavailable; extra exports expose internal helpers - Review code style — LLMs mix styles; enforce your style guide with
styler::style_pkg()after generation - Run
devtools::check()— treat any NOTE or WARNING as a bug, not a suggestion
Summary
R Packages
- A package is the standard unit for sharing functions, data, and documentation in R
usethis&devtoolshelp to streamline package development- Data packages (e.g.
munichvisitors) distribute clean, documented datasets — a great first package roxygen2turns#'comments into.Rdhelp files — document as you write
Development workflow
Documentation & Design
- Every exported object needs
@param,@returns,@export, and@examples - Expose data as an argument (
data = museum_visitors) when users may want to filter or swap it - Single responsibility — each function does one thing; package groups functions with a shared theme
- Consistent interfaces —
datafirst, options last with sensible defaults - Limit dependencies — every imported package is a liability your users inherit
Tip
Ask: if a colleague installed this tomorrow with no context, would the function names tell them what to call and when?