Advanced Statistical Programming using R
Week 9: Reproducibility, Open Data & renv
2026-06-11
Announcements
New Checkpoint for Group Project
- Project Proposals were due Mon 8 Jun.
- General feedback today
- NEW: Progress Update due Jun 29
- We are adding another project checkpoint to give group-specific feedback
- Keep updating and refining your project proposal/plans, especially in the next 3 weeks
- On Jun 29:
- submit links to rendered website, project plan and GitHub repo via Moodle
- Moodle form will open closer to submission date
- we will provide feedback via GitHub issues
This week
- General Project Proposal feedback
- Reproducibility and renv
- Open Data and documenting data science projects
- Teaching Evaluation
- Feedback and project question time
Questions about your specific proposal or project?
We will end the lecture a little earlier today for Teaching Evaluation. If there is additional time, you may ask questions about your specific projects.
You should also attend the upcoming practicals to get additional feedback and suggestions for improving your projects.
Project Proposal Feedback
General Comments & Consultation Time
- We’re off to a great start!
- 20~ unique projects
- 15~ different datasets
- You were not expected to write perfect proposals!
- We will discuss general feedback in lecture today.
- For specific feedback, attend in upcoming practicals or ask me at the end of the lecture
General Feedback
Good enough proposals showed:
- engagement with the datasets (e.g. constructing non-overlapping age categories)
- curiosity and uncertainty about the data and possible analyses (e.g. evaluating two different datasets)
- clear decisions over project scope (e.g. what to explore, what not to explore and why)
- specific details about project governance and organisation (e.g. potential branch names and git commit messages)
- application of principles and ideas from prior weeks
Weaker proposals:
- had very generic, non-specific or too many research questions
- provided suggestions or lists of possible analysis methods or data cleaning issues (e.g. deal with missing values, use time series analysis), without connecting them to their particular dataset or context
- overly broad audience and context framing (e.g. academic and business and general public)
- polished but vague language suggestive of AI-generation, without AI disclosure
Areas for Development
Note that you were not expected to address all these areas in your proposals. You will have the chance to revise your project plans as we cover relevant content in upcoming weeks.
Scope & Focus
- Make decisions — one audience, one dataset, focused research questions
- Volume of poorly completed analyses does not compare to one good portfolio piece
- Prioritise which research questions you can actually finish in the remaining weeks
Choice of Datasets & Describing Your Data
- Using clean datasets is easy but misses the point — show you can handle messy real data
- Describing the data file ≠ describing the dataset: what does
100 rows, 10 variablestell you? - Include all relevant context and discuss trade-offs when choosing between datasets
Areas for Development (cont.)
Analysis Plans
- Plans should be specific:
- “We will estimate the following model: …” not “we will use time series analysis”
- Give model specifications with variables, not just method names
- Stick to methods you’ve studied — you must be able to understand and explain everything
Communication Style and Clarity
- Review and edit AI-generated text — if it’s boring for you to read, it’s boring for others too
- Write less — prioritise correctness and clarity over generating more text
- Use meaningful headings — not “Exercise 1, 2, 3”
Let’s look briefly at an actual project from your peers!
From Proposals to Project Plans
- Submitted proposals are Draft Project Plans:
- datasets & IDA: what data are you exploring?
- research questions: what are you trying to investigate or learn?
- analysis methods: how will you investigate your questions?
- data preparation: what preparation is required to interpret your data and conduct your planned analyses?
- final outputs: what formats will you use to document and present your analysis process and findings?
- Continue to refine and update your project plans based on:
- applying concepts in Part 2: Working with Real World Data (W7-11)
- practising Part 1: Statistical Programming Skills (W2-6)
Relation to Oral Exam
- Students who submit individual contribution statements will have oral exam questions related to their own work — otherwise, questions will involve generic projects
- We will ask questions based on your final project outputs and documentation — feel free to revise as you like
- Groups are also free to split up or combine
Exam questions beyond your projects
We may ask you about topics not demonstrated in your group project (e.g. R packages, even if your project doesn’t include one)
Preparing for the exam via the project
- Remember the learning objective of the project is to gain hands-on experience with examinable tools, concepts and ideas!
- Design your project to give yourself learning opportunities! Pick a challenging but not overwhelming scope of goals.
- Choose data you are actually interested in.
- Choose simple models — you may be asked to explain why you chose the model, how it works, and how to interpret the results of the model.
- Check Project Guidelines weekly for additional tips/guidance/FAQs.
- Attend the practical for hands-on assistance and structured exercises to help you develop your projects
Tip
This week’s practical is an opportunity to update your project plans, set up renv, and improve your data and overall documentation.
Additional Tips: Pick Slightly Messy Datasets
Choosing clean/simple datasets is not as clever as you think! How will you answer exam questions about cleaning datasets?
- The project is not graded — there is no penalty for trying something harder and not quite finishing it
- A clean dataset with a standard analysis question is a fine starting point, but it limits what you can learn
- This is your chance to get hands-on experience and feedback in a low-stakes setting — use it
- Try a messier dataset, or a less standard format
- Get to know your data — where it came from, how it was collected, what the variables actually mean
- A polished report on poorly understood data is not a skill worth developing
- Real-world data contexts (business, surveys, administrative records) reward analysts who ask: “what does this variable really measure?”
Additional Tips: Don’t Panic!
For many of you, this might be the first time you’ve worked with real-world data, and it might be a little bit overwhelming.
- Don’t panic, it’s normal to feel overwhelmed!
- Real data work involves lots and lots of decisions: what to clean, what to keep, what to model, how to present
- The project is deliberately open-ended because that is what working with real data actually feels like
- Your job is not to make perfect decisions — it is to make decisions, document them, and be able to explain them
Tip
Feeling stuck is a sign you are thinking carefully, not that you are doing it wrong.
Additional Tips: Challenge yourself
You can often learn more from a partial attempt at something challenging than from a polished version of something trivial. Some suggestions for stretching yourself:
- Turn code for data import, cleaning, or tidying into functions — and collect them into an R package. Add some of your analysis as a vignette.
- Design an interactive dashboard for exploring your data. What would it show? You don’t have to actually build it.
- Experiment with suggested extension or bonus packages, ideas, tools covered in earlier lectures
- Try extended Quarto website features like custom theming or multi-format output.
- Publish a pkgdown website for your R package
Additional Tips: Attempt Different Final Outputs
Once you have developed your baseline analysis and results, shift your attention to practising your presentation and communication skills.
- For example, a report and a dashboard and an R package can be based on the same dataset and analysis.
- You are not limited to a single output format. You can try multiple formats, especially if you are working in a group
- Different group members can work on different formats on separate branches.
- Each format develops a different skill — choose based on what you want to practise
Only one final URL
Make sure any additional outputs can be reached from your website homepage — i.e. make sure to add links to all presentation outputs to the navigation bar.
Additional Tips: Using GitHub Issues to Document Decisions and Learnings
Learning is a reflective and reinforcing process. Try to keep track of what has been done, what has been decided, and what you’ve learnt. In addition to the weekly reflection logs, you might also use GitHub Issues to coordinate your group’s work:
- Open an issue for each project task — assign it to one group member before they start
- Write the task goal and details — e.g. the variables you’ll use, and a rough target date in the issue body
- Close the issue with a reference to the commit when the task is done
Tip
Issues create a record of who was responsible for what — this is exactly what your contribution statement will draw on. One issue per task is better than one big issue for everything.
Reminder: Key dates
| Milestone | Date | Submission |
|---|---|---|
| ✓ general feedback in class today | ||
| Progress Update | 29 Jun | URL to rendered site, updated Project Proposal |
| Group reflection — in-class discussion | W14 practical | N/A |
Final submission + group-reflection.qmd |
Due 22 Jul | URL to final website/webpage, group reflection doc |
| Individual contribution statement | Due 23 Jul | PDF via Moodle |
| Oral exam | 29 Jul | — |
Reminder: Project Contents
Make sure your repository includes:
README.mdwith all group member names- Contribution statements — one file per group member in a
contributions/folder (e.g.contributions/alice.qmd):- sections/files you were primarily responsible for
- key tasks completed (1–3 bullets)
- collaborative tasks you participated in
- AI tools disclosure — document how you used LLMs per department guidelines
- Data licence — document the licence for your dataset in your README and/or data description
Syllabus
Syllabus
Part 1: Statistical Programming Foundations
- W02: Scripts, Functions & Refactoring
- W03: Debugging
- W04: Version Control & Remotes
- W05: Quarto Websites & Collaborative Coding
- W06: R Packages
Part 2: Working with Real World Data
- W07: Initial Data Analysis & Data Cleaning
- W09: Reproducibility, Open Data & renv
- W10: Modelling & Analysis
- W11: Statistical Communication & Visualisation
Part 3: Advanced Topics & Summary
- W12: Interactive Data Storytelling
- W13: Multi-lingual Analysis (Python/R)
- W14: Review & Outro
Last Week
IDA: Key ideas
- IDA is a systematic pre-analysis step — it checks data integrity without touching the research questions
- IDA issues occur at univariate, multivariate, and dataset levels — check all three
- Tidying (reshape/rename) ≠ cleaning (fix values/types) ≠ screening (characterise) — they overlap but have different goals
- All preparation decisions must be documented and justified in a reproducible script
Screening: Data types & formats
- Declare column types explicitly on import — avoid relying on guessing
- Use
lubridatefor dates; other specialist packages for geospatial (sf), time-of-day (hms), factors (forcats) etc. - Check every column: does the R type match the real-world meaning of the variable?
- Use
glimpse()for the whole table;str()for a single column
Cleaning: tools & fixes
- Plot first — histograms, boxplots, and line plots reveal issues that
summary()hides - Hypothesise before fixing — ask why a value looks wrong before deciding how to handle it
- Variable-level: recode types (
as.*()), flag/replace out-of-range values, standardise encodings - Structural: remove duplicates (
distinct()), reshape (pivot_*()), split/merge columns (separate(),unite()) - Not handling missingness is itself a decision — document it either way
Missingness
- Explicit missingness (
NA) — visible; find withis.na(),summary(),naniar::vis_miss() - Implicit missingness — absent rows; requires domain knowledge about expected structure
- Use
tidyr::complete()ortsibble::fill_gaps()to make implicit missingness explicit - The missing data mechanism (MCAR / MAR / MNAR) determines whether dropping or imputing is valid
Reproducibility
Adapted from: https://rcp.numbat.space/week1/#/etc5513-title
Why reproducibility?
The problem
- Analysis depends on many small decisions — which file, which version, which parameters
- Manual workflows break when data or requirements change
- Hard to verify, share, or build on work that can’t be re-run
The payoff
- Easier to catch and fix your own mistakes
- Collaborators (and future you) can understand and extend the work
- Others can build on it — higher impact
- Professional standard in data science
Types of reproducibility
From the US National Academies (2019):
- Computational reproducibility — same input data, same code, same conditions → same results
- Replicability — same scientific question, new independently collected data → consistent results
- Robustness — same data, different reasonable analysis choices → consistent conclusions
Tip
A result can be computationally reproducible but not replicable — and vice versa.
Related concepts
- Reuse — making data and code available for others to build on; requires open licences, good documentation, and accessible formats
- Transparency — sharing enough about your methods that others can evaluate your work, even without re-running it
- Open science — a broader commitment to making research outputs (data, code, publications) publicly accessible
- Literate programming — combining narrative text, code, and output in one document so analysis, explanation, and results are inseparable (e.g. Quarto, R Markdown)
- Version Control — systematically recording changes to files over time, enabling rollback, branching, and collaboration (e.g. Git)
Tools for computational reproducibility
Reproducing a result requires the same environment at every level:
| Level | What it covers | Tools |
|---|---|---|
| 1–3 | OS, system libraries, R version | Docker, Singularity, rang |
| 4 | R packages | renv, packrat, checkpoint |
Tip
renv does not replace Docker — it solves a narrower, more common problem: fixing which package versions a project uses.
Reproducibility in StatProg2
The scope of reproducibility practices and tools is extremely broad. We will focus mainly on:
- Partial reproducibility with renv. Full computational reproducibility can be quite technically challenging and not within the scope of our course.
- Transparency & documentation since reproducibility is a means, not an end — the goal is trustworthy, reusable, cumulative knowledge.
- Reuse and modularity through well-designed functions, packages, and well-structured repos.
- Literate programming, and version control via Quarto and Git.
renv
For extended tutorial see:
What is renv?
- Creates a project-specific R library — packages are isolated from your global installation
- Uses a shared package cache — the same package version is not downloaded twice across projects
- Records exact versions in
renv.lock— a plain-text snapshot of your environment - Does not fix R itself, system libraries, or the OS
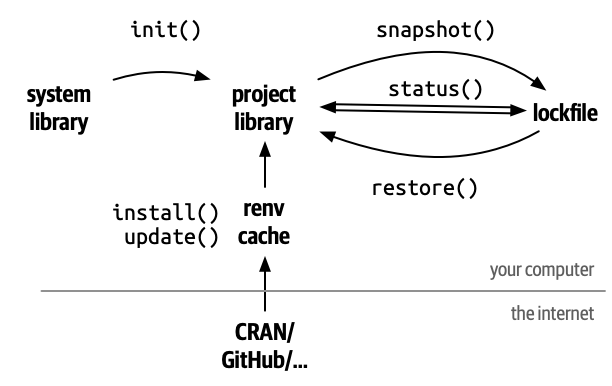
Getting started: what renv::init() creates
renv/— the project-local library; packages install here instead of your global libraryrenv.lock— a JSON snapshot of every package name, version, and source.Rprofile— activates renv automatically when you open the project
Tip
renv/library/ is automatically added to .gitignore — compiled binaries are platform-specific and are always rebuildable from renv.lock.
Key renv commands
renv::status()— compare installed packages againstrenv.lock; run this first to diagnose problemsrenv::snapshot()— updaterenv.lockto match what is currently installedrenv::restore()— install packages as recorded inrenv.lockrenv::install()— install from CRAN, Bioconductor, GitHub, etc.renv::update()— get latest versions of all dependencies
The renv collaborative workflow
- One member runs
renv::init()thenrenv::snapshot() - Commit
renv.lock,.Rprofile, and.gitignore— push to GitHub - Every other member pulls, opens the project, and runs
renv::restore() - Whenever anyone installs or updates a package: run
renv::snapshot()and commit the updated lockfile
Important
Treat renv.lock like a DESCRIPTION file — commit it every time you add or update a package.
Open Data Principles
What is open data?
“Open data can be freely used, modified, and shared by anyone for any purpose.” — Open Definition
Legal openness
In the public domain or under liberal terms — commercial and non-commercial use permitted, minimal restrictions
Technical openness
Machine-readable, non-proprietary formats; accessible via freely available tools; no passwords or paywalls
Why should we care about open data?
- Government transparency — analysis of Canadian Revenue Agency data identified $3.2 billion in fraudulent charitable tax shelters (2007)
- Business innovation — Transport for London’s open APIs power 600+ apps and generate ~£130m/year in economic benefit (Deloitte, 2017)
- Personal & civic empowerment — a woman in Denmark built findtoilet.dk using open government data, so that people with bladder problems can trust themselves to go out more
Examples from: Open Data Handbook — Why Open Data?
Tip
Open data creates value beyond the original collection purpose — but only if it is findable, accessible, and well-documented.
Extension: FAIR Principles
Introduced by Wilkinson et al. (2016) to guide sharing of scientific data — now widely applied in research and open data contexts.
Findable
Persistent identifier (e.g. DOI); rich, searchable metadata
Accessible
Retrievable via standard open protocols; metadata remains accessible even if data is not
Interoperable
Standard, open formats; shared vocabularies and schemas
Reusable
Clear licence; documented provenance; meets community standards
Open Licensing
- An open licence grants anyone the right to use, share, and often modify a work — without needing to ask permission
- No licence ≠ free to use — without a licence, default copyright applies and others cannot legally reuse your work
- Licences vary by what they require in return:
- Attribution (BY) — credit the creator
- Share-alike (SA) — derivatives must use the same licence
- No derivatives (ND) — no modifications allowed
- Non-commercial (NC) — commercial use prohibited
- Different licence families for different materials: Creative Commons (data, text, media), OSI-approved licences (code)
Common Open Data licences
| Licence | Attribution? | Share-alike? | Commercial use? |
|---|---|---|---|
| CC0 (Public Domain) | No | No | Yes |
| CC BY | Yes | No | Yes |
| CC BY-SA | Yes | Yes | Yes |
| ODbL (databases) | Yes | Yes | Yes |
Tip
“Attribution required” means naming the publisher, dataset title, URL, and licence — not just “Data from [website]”.
Choosing a licence
- Choose a licence for each component: data, code, and written content may need different licences
- Use choosealicense.com for code; creativecommons.org/chooser for data and text
- Create a plain text file named exactly
LICENSE(orLICENSE.md) in the root of your repository - Reference the licence in your
README.mdand any data documentation
For software licences, see: The Turing Way — Licensing
Open Data in StatProg2
Just like broader reproducibility practices, open data involves lots of different tools, platforms and standards. We focus on:
- Legal openness — know how to read and choose licences (CC0, CC BY, ODbL); document the licence for any dataset you use
- Technical openness — preferring standard formats like CSV. Even working with confidential or proprietary data, you want it to be easily re-used within your team or organisation.
- Documenting datasets — technically open data without documentation is ultimately not re-usable!
Documenting data science
General principles
- Document all important decisions in your workflow — not just what you did, but why
- Documentation should support understanding and trust in data analyses and findings
- Keep documentation easy to find and as concise as possible — long documentation that no one reads is not useful
- Documentation must accompany computational reproducibility — without it you don’t know what you are re-computing
- Document your environment: software versions, packages, and dependencies (e.g.
renv.lock,sessionInfo()) - Document contributions — who did what, and when; use git history, issues, and contribution statements
Documenting datasets
What would a new collaborator get wrong about your data if they only read your description and not the source page?
- What — what does the data measure or represent?
- How — how was it collected? (survey, sensor, scrape, administrative record)
- Who & when — who collected it, for what population, over what period?
- Variables — a data dictionary with descriptions, units, and codes
- Licence — under what terms can it be used and shared?
- Limitations — known gaps, biases, or quality issues
Tip
Describing a data file is not describing a dataset — what can someone learn about the world from this data?
Identifying documentation gaps
Most datasets — including open ones — are only partially documented. Check for:
- Column names whose meaning, units, or valid values are not obvious from the name alone
- Known quality issues not flagged in the file itself (sensor outages, missing periods, revisions)
- Metadata that lives only in a prose aside on the portal page, not in the data file
- Links that are not documented — if you needed to check the source methodology, where would you look?
Different stages, different documentation
| Stage | Goal | Documentation output |
|---|---|---|
| IDA | Check data integrity before analysis | Issues log, decisions + justifications, cleaning script |
| EDA | Generate hypotheses, explore patterns | Annotated notebooks, summary of key findings |
| CDA | Answer pre-defined research questions | Methods, results, discussion; formal report |
All stages require a reproducible record of decisions — not just what you did, but why.
Documenting Initial Data Analysis (IDA)
What would someone need to read to understand how and why you prepared and used your data?
- Primary record: a reproducible script (
data-raw/) that runs from raw → clean - Log all issues found — univariate, multivariate, and dataset levels
- Document decisions, not just actions — why was this row dropped? why this imputation?
- Summary tables of issues (before/after) help readers scan findings quickly
- R packages are a natural home:
data-raw/for scripts, vignettes for narrative — IDA and packages are friends!
Documenting Exploratory Data Analysis (EDA)
What would someone need to read to understand why you asked your research question?
- EDA is non-linear and associative — hard for others to follow in full
- Summarise findings as you go — annotate what surprised you, not just what you did
- Be selective: document paths that led somewhere, not every dead end, unless the pattern of dead ends is interesting!
- Computational notebooks (like Quarto) are great formats for interweaving code-driven data exploration and documenting observations and reasoning.
Documenting Confirmatory Data Analysis (CDA)
What decisions in your analysis would a reader need to know about to evaluate your conclusions?
- State research questions and hypotheses before testing — post-hoc hypothesising undermines validity
- Document every modelling decision: variable selection, transformations, reference categories, sample restrictions
- Report uncertainty honestly: confidence intervals, standard errors, not just point estimates
- Note any deviations from the original plan — changing the analysis after seeing results must be disclosed
- Pre-registration (formally recording hypotheses and analysis plan before data collection) is the gold standard for confirmatory work
Documentation in practice
Documentation needs vary by context — there is no universal standard:
Research
Formal stages (IDA/EDA/CDA), pre-registration, discipline-specific reporting standards
Business / industry
Reproducibility within the organisation; changelogs, access controls, and data dictionaries often matter more than formal stages
What might “good documentation” mean across different audiences and use cases?
TIP: Spreadsheet Data Basics
Broman & Woo (2018): Data Organization in Spreadsheets explain a set of principles that apply regardless of context, including:
- Be consistent — names, formats, codes, file structures
- Dates as
YYYY-MM-DD— unambiguous, sorts correctly - One value per cell; rectangular structure — makes data machine-readable
- Fill in all cells — no empty cells to mean “same as above”
- Choose good names — no spaces, no special characters, meaningful and short
- Keep raw data raw — no calculations or edits in source files; no font colour or highlighting as data
- Save as plain text (CSV) and include a data dictionary
ASIDE: Reporting CDA
Formal reporting standards exist for specific study types:
- STROBE — observational studies (cohort, case-control, cross-sectional)
- CONSORT — randomised controlled trials
- PRISMA — systematic reviews and meta-analyses
Important
Designing documentation standards is hard, ongoing work — STROBE took years of community effort and is still evolving. Most data science contexts have no agreed standard yet.
Summary
Reproducibility
- Computational reproducibility: same data + same code → same results
- renv fixes package versions; Docker fixes the full environment; Quarto + Git handle code and narrative
- Reproducibility is a means — the goal is trustworthy, reusable, cumulative knowledge
renv
renv::init()creates a project-local library and records versions inrenv.lockrenv::snapshot()updates the lockfile;renv::restore()rebuilds the library from it- Commit
renv.lockto git; addrenv/library/to.gitignore
Open Data
- Legal openness: know how to read and apply licences (CC0, CC BY, ODbL)
- Technical openness: use standard, open formats (CSV, plain text)
- FAIR: data should be Findable, Accessible, Interoperable, Reusable
- Always document the licence, provenance, and context of any dataset you use
Documenting data analyses
- Document decisions, not just actions — why at every stage (IDA, EDA, CDA)
- Keep a reproducible script from raw data to clean data in
data-raw/ - State hypotheses before testing; disclose any deviations from plan
- Well-organised data: consistent names,
YYYY-MM-DDdates, one value per cell, plain text files
Project Tips
Key reminders from proposal feedback:
- Make decisions — one dataset, one audience, focused research questions
- Know your data — describe context, provenance, and variables; don’t just describe the file
- Be specific in analysis plans — give model specs with variables, not just method names
- Write less, say more — clarity and correctness over volume
- Next checkpoint: Progress Update due Jun 29
Teaching Evaluation
Your feedback matters (5 mins)
- This is my first time teaching this course, and we rewrote the course pretty much from scratch
- I would love to know what has worked well in the lectures and what could be improved.
Please log on to:
https://www.lehrevaluation.uni-muenchen.de/evasys/public/online/index
Lösung: 4JQS5
